There’s a widening gap between big stores’ and little stores’ markups, and for once the small guys are doing better.
The latest results across our store comparison data show a rolling 12-month increase of 0.23 percent in sales for the month of May compared to April. Based on average data, this is a $3,600 increase in sales figures for May 2015 versus May 2014 with annual rolling sales of $1,553,321 against $1,549,704.
As the data shows, sales have continued their steady increase with average May results for this year of $135,564 per store against $131,947 in 2014 and $109,699 in 2013. The total number of items sold is up 7 percent to 592 pieces with gross profit increasing to $64,688 from $61,637.
This month we delve into the area of markups and draw an interesting comparison between the figures being achieved back in 2010 and now. Given the rosier climate that most stores are operating in you would expect to see healthier margins being achieved now but that it isn’t the case.
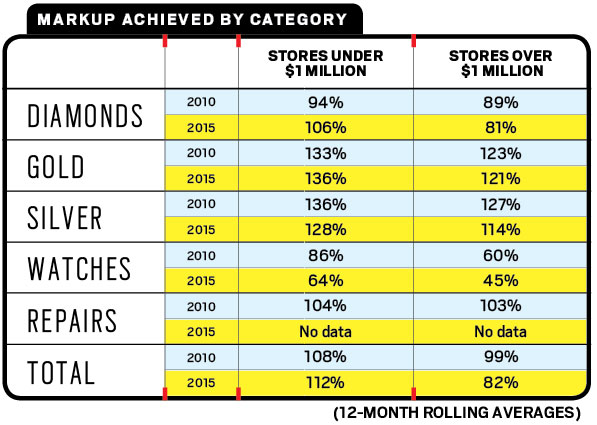
Smaller stores consistently show better margins over both time periods with stores under $1 million in sales reporting a markup achieved of 108 percent for the rolling 12 months in 2010 versus 112 percent in 2015. Larger stores, however, have been struggling. Their already lower markup of 99 percent has fallen even further to 82 percent. An increase in diamond sales at a higher average price could account for that but as we look deeper into the numbers it becomes clear that this is not just about diamonds. For the stores doing over $1 million in sales, markup has dropped across every area.
Advertisement
Diamond sales have dropped in their achieved markup from 89 percent to 81 percent. Gold has shown a reduction from 123 percent to 121 percent, with silver down from 127 percent to 114 percent. Watches have seen a reduction from 60 percent to 45 percent. Clearly the drop isn’t just attributable to more big-ticket items.
Let’s compare these figures to the stores doing under $1 million in sales. Diamonds have increased in markup for these smaller stores from 94 percent to 106 percent, with gold up from 133 percent to 136 percent. Both silver and watches have shown a decline.
So why have smaller stores increased their diamond markup by 12 points while the larger ones have dropped theirs by 8 points? It may be an indication of increasing competitiveness in the higher-end diamond market (or at the very least the perception by store-owners that this is happening). Stores doing over $1 million in sales have an average diamond sale of $2,200 versus $1,400 for the smaller stores. They are also achieving more than double the volume of sales. If big-ticket items are becoming more competitive, then this might explain why the larger stores are being hit in this area.
But what about other departments? Why are larger stores achieving only 114 percent on silver versus the smaller stores’ 128 percent? There may be a greater percentage of larger stores who don’t carry silver but for those that do, it seems strange why they wouldn’t be doing better in this area.
This article originally appeared in the August 2015 edition of INSTORE.
David Brown is president of the Edge Retail Academy. To learn how to complete a break-even analysis, contact inquiries@edgeretailacademy.com or (877) 569-8657.
Advertisement