David Brown: Measure Your Key Performance Indicators
Part 2 of 2: Combine markup and stockturn to know your gross profit.
BY DAVID BROWN

Published in the March 2012 issue
Last month we talked about retail sales, which consist of average sale multiplied by the quantity of items sold. This month, we want to talk about two other key performance indicators: markup and stockturn, which combined produce your gross profit and return on investment.

Advertisement
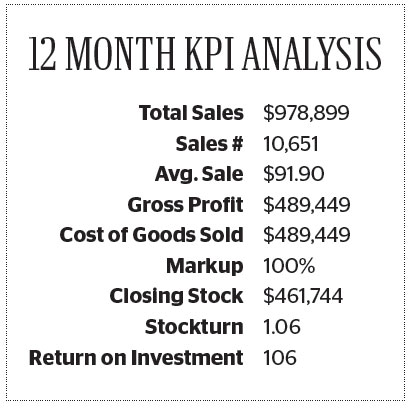
The sales figure above of $978,899 is made up of the 10,651 items sold multiplied by the average sale value of $91.90.
This month, our emphasis is on return on investment, or ROI. This is a measure of how much you get back for every $100 invested in inventory. It is a multiplier of markup and stockturn — in other words, how much profit you make on each item you sell times how often you can sell it.
ROI is an important measurement because it determines how effective your investment has been. In the same way that annual interest rate measures how effective your money has been performing for you at the bank, ROI determines how effective your money has been invested in stock for your store. An ROI of 200 means the owner has generated $200 of gross profit for every $100 invested in stock.
In the above statistics, the average ROI across the stores measured is 106, or a return of $106 for every $100 invested in stock. This is calculated by multiplying the markup of 100 percent by the stockturn of 1.06 times per year.
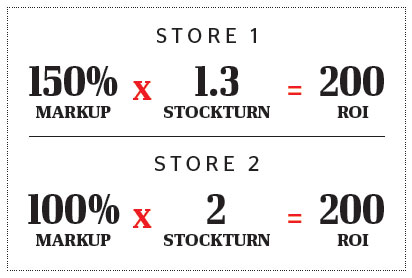
As the saying goes, there is more than one way to skin a cat, and likewise, there is more than one way to achieve a return on investment. Two stores may achieve an ROI of 200 in the following way:

Advertisement
The key to using this information each month is to compare it to your own store’s performance in each area and to identify opportunities.
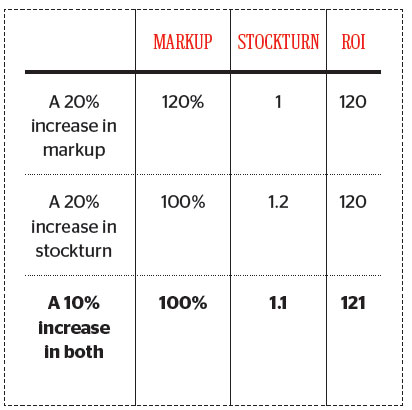
As we discovered in last month’s article, a 10 percent increase in both stockturn and markup will provide a better result than making a 20 percent increase in just one area or the other. Let’s illustrate using an example that has 100% markup and 1 stockturn as its starting point:

A strategy that combines an increase in both areas can be easier to manage and give a slightly better return on investment than a large increase in just one area.
The important thing is to measure. Look at your year-todate reports to determine the current markup and quantity being achieved — once your strategy is in place you can then use the monthly reports to track how you are going.
About the Author: David Brown is President of the Edge Retail Academy, an organization devoted to the ongoing measurement and growth of jewelry store performance and profitability. For further information about the Academy’s management mentoring and industry benchmarking reports contact Carol Druan at carol@edgeretailacademy.com or Phone toll free (877) 5698657 Edge Retail Academy, 1983 Oliver Springs Street Henderson NV 89052-8502, USA
Advertisement
{JFBCLike}
{JFBCComments}