How did you do?
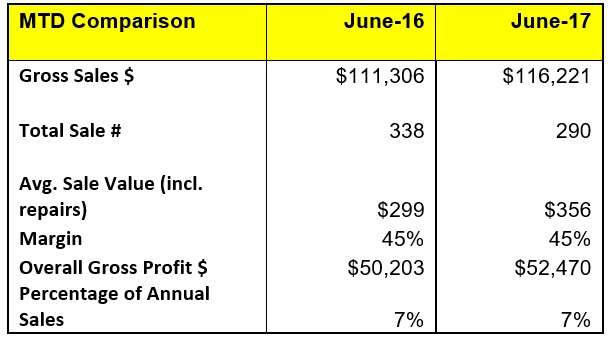
The halfway mark of the year has seen our rolling 12-month figures continue to increase after May’s 0.4 percent uplift with a 0.31 percent increase in the 12-month totals across our sample stores. Annual sales rose from $1.596 million to tick over the $1.6 million mark for the first time since September 2016 when the pre-election jitters kicked in. Monthly sales for June were $116,221, up 4.5 percent from $111,306 last year. Sales quantity for the month was down 14 percent from 338 to 290 units with average retail value up from $299 to $356. Margins held steady at 45 percent, resulting in an increase in gross profit for the month to $52,470 from $50,203 last year, or an additional $2,267.
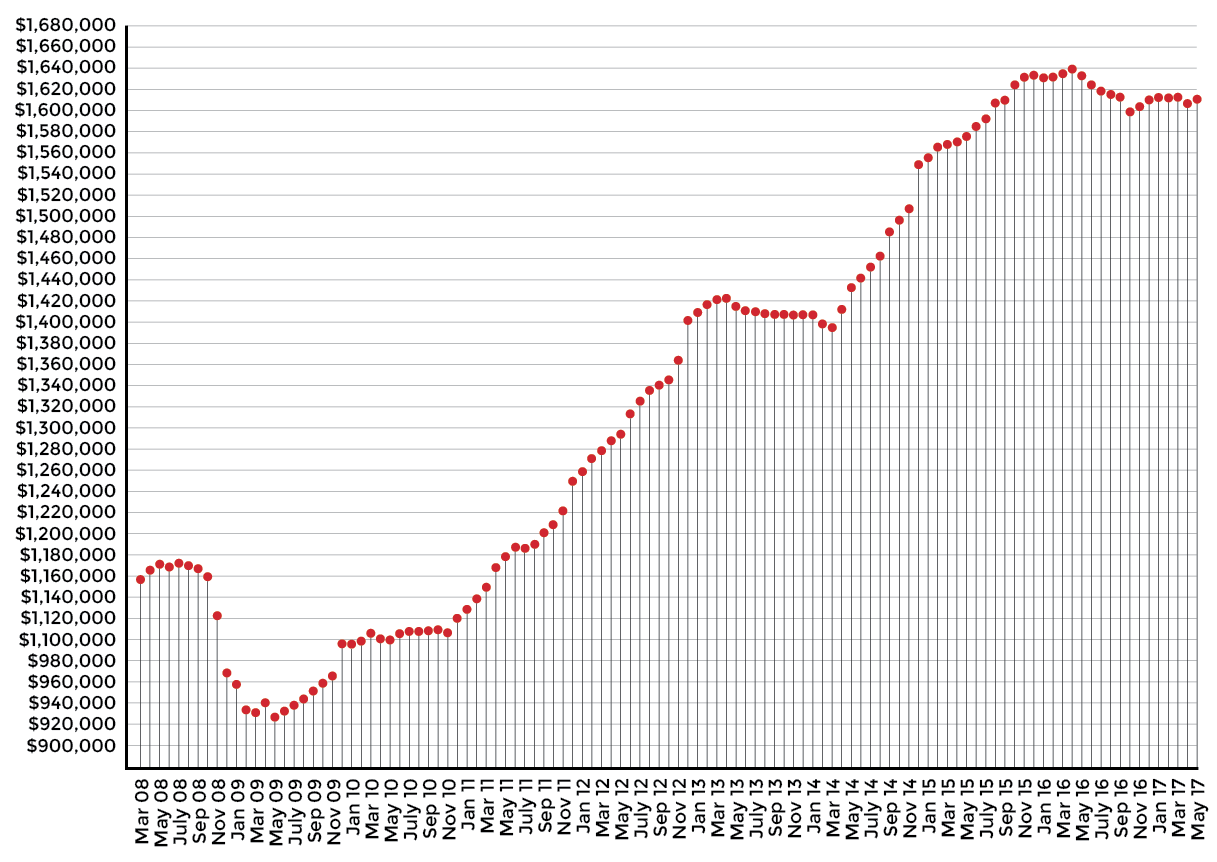
Despite only five of the last 12 months of trading showing a decline in annualized sales, the average store is reporting rolling 12-month revenue of $1.601 million, down from $1.612 million this time last year. In fact, a quick review of sales data for the last few years shows that after a number of years of strong growth the average store has largely flat-lined since the middle of 2015.
US Average Store Gross Sales
Rolling 12 Months
Advertisement
The second half of 2015 was the beginning of the decline in sales volume – a headwind that could no longer be offset by the increase in average sale being achieved.
Of course, these figures represent an overview of performance across several hundred stores – the important comparison is your own individual data. So how have you performed?
You may not have rolling 12-month data for your store at your fingertips but you can probably take a snapshot from two years ago and compare how you’ve performed. Grab your month-to-date store printouts for June 2017 and June 2015.
What sales did you do in the respective months? This may not give you an accurate indication of how your figures are over the long term, so focus in on your average sale and sales volume for the two periods. If you have followed the average trend you will see a high average sale being achieved in the later period but a lower volume of sales.
If you’ve established this trend is happening to you (and I would check a couple of other months to be sure) you need to determine where it is happening. Which departments are responsible for the difference?
Advertisement
From your reporting system you should be able to generate a year-to-date department report for the 12-month periods you are evaluating. (YTD June 2015 and YTD June 2017). This is the most effective way to compare the period and determine if a trend is happening. View the trend per report for average sale, sales units achieved and overall sales figures. If you have determined your sales are flat-lining then delve deeper into your departmental numbers. Which departments have experienced an increase in sales units and which have decreased? Which have seen their average retail sale go up and which have declined?
Do you have door counter figures? This is one of the most effective ways to measure your marketing. You can divide your average foot traffic for the year against your marketing spend to determine your cost per visitor. You can also compare your ratio of unit sales to visitor numbers. If your sales units have dropped, have your visitor numbers dropped also or are you converting less people? If your visitor numbers have dropped your problem may be your marketing. If your visitor numbers are steady or up but sales are down then it might be time to look at your staff training or product selection.
Business is a game of trends and numbers. Follow the trend, analyze the numbers and the area you need to focus on will quickly be revealed.
DAVID BROWN is president of the Edge Retail Academy, an organization devoted to the ongoing measurement and growth of jewelry store performance and profitability. For further information about the Academy’s management mentoring and industry benchmarking reports, contact inquiries@edgeretailacademy.com or phone toll free (877) 569-8657.