Average ticket reaches record high but it’s not enough to reverse slump.
Data fresh in from our store analysis shows that across the U.S., average store performance declined by 0.16 percent on a rolling 12-month basis between August ($1,602,895) and September ($1,600,311). The decline of $2,584 reflects a drop in sales of $112,239 in September 2015 to $109,655 for the same month this year.
This article originally appeared in the November 2016 edition of INSTORE.

The declines in rolling 12-month sales for each of the last five months are as follows:
- September – 0.16 percent
- August – 0.18 percent
- July – 0.44 percent
- June – 0.57 percent
- May – 0.48 percent
Advertisement
MTD
COMPARISION |
AUGUST
2015 |
AUGUST
2016 |
| Gross Sales $ |
$112,239 |
$109,655 |
| Total Sale # |
419 |
302 |
Avg. Sale Value
(incl. repairs) |
$247 |
$332 |
| Margin |
46% |
45% |
| Overall Gross Profit $ |
$51,648 |
$49,797 |
Percentage of
Annual Sales |
7% |
7% |
Not since April have we seen an increase in the annual sales figure for the businesses monitored. In fact, we have to go back to late 2008/early 2009 – the beginning of the Great Recession – to find five consecutive months of shrinking sales figures to compare.
Undoubtedly the election uncertainty is a contributing factor, and it does not seem a coincidence that the beginning of the downturn coincided with the moment that the Republican and Democratic frontrunners became clear. Once the public can identify the options available to them, election focus increases and politics and the economy become a greater “front of mind” factor for the average consumer.
With that in mind we may be in for another month or two of these sorts of performances, especially given the acrimony that is building between the candidates. Only then will we be able to assess the impact of the election and whether this situation is circumstantial or an indication of a bigger underlying problem.
Again we are continuing to see a heavy falloff in items sold, but this is compensated partially by the increase in average retail value sold. In fact, the last three months have seen the highest recorded monthly average retail sales figures since we started collecting our data.
Advertisement
US Average Store Average Sale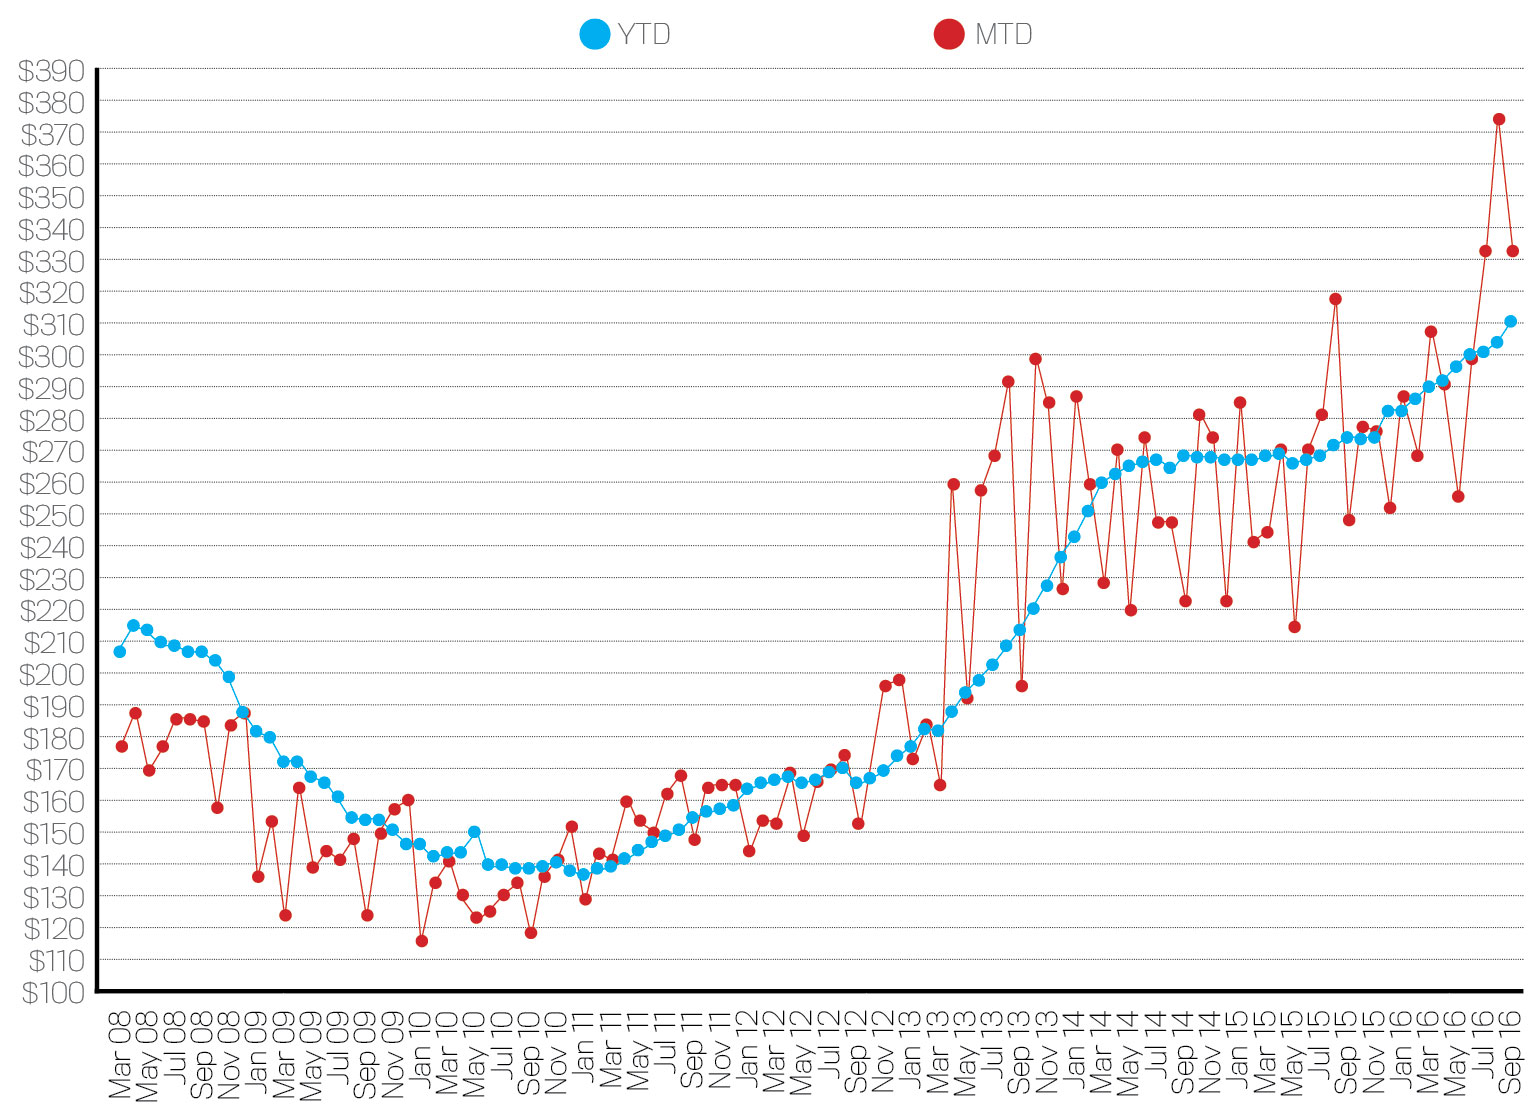
The red line represents monthly average retail sale achieved with the blue line reflecting the rolling 12-month trend in average retail sales. Perhaps the most interesting thing about these numbers is the variation that occurs month to month between the early data and the later numbers. Up until March 2013 the range changed very little, rarely moving more than $10 to $20, or on the odd extreme occasion, $40 or $50 in average retail sale from month to month. This was the period of growth in the bead market and high volumes of lower priced product. From around May 2013 onwards we see a significant increase in average retail value being achieved but also a greater variaiton on month-by-month average sale occurring. Suddenly swings of $40 to $50 are the norm, with some months even showing a movement of $100.
Why the greater variation? As buying habits returned from cheaper product to more high-end jewelery (we noted previoulsy how the percentage of diamond product has increased from 38 percent to over 50 percent of total store sales) we have seen the impact that variations in high-end product can cause. A silver sale might be worth $30 or $300, while a diamond ring can be $500 or $50,000. This creates a greater variation, and less certainty, for the jeweler concerned.
It’s interesting to note with the current economic uncertainty that it’s not diamond sales that are suffering. The decline is in high-volume silver product, hence the large drop in volume but high increase in average retail price. Those with higher-end aspirations don’t seem to be affected by the current uncertainty, yet this goes against the instinct of many store owners. When times are uncertain many will cut back on stocking their higher-end items assuming this part of the market will dry up. The reverse seems to be the case.
How are your diamond inventory levels? How are your diamond sales? If they have declined is this because of a genuine lack of interest from buyers or a conscious withdrawal by you based on a belief this area will dry up? Don’t forget a decline in sales can be a self-fulfilling prophesy if you make assumptions about it.
Advertisement
David Brown is president of the Edge Retail Academy. To learn how to complete a break-even analysis, contact inquiries@edgeretailacademy.com or (877) 569-8657.