It was a comeback month.
May delivered a solid bounce in sales at the independent jewelry stores in our survey group, recovering much of the ground lost in April. Average results for May saw monthly sales of $134,119, up from May 2016’s figure of $127,694. This represented an increase of just over 5 percent in the year-on-year comparison. The rolling 12-month data shows an increase in annual sales from $1.589 million to $1.596 million, up 0.4 percent, which claws back much of last month’s 0.5 percent decline.
With a number of additional stores coming on board in the last few months, our data now consists of over 800 stores with total annual sales of more than $1.3 billion in the U.S., providing a depth of data which is continuing to increase every month.
Here’s a quick summary of the results achieved for the last six months.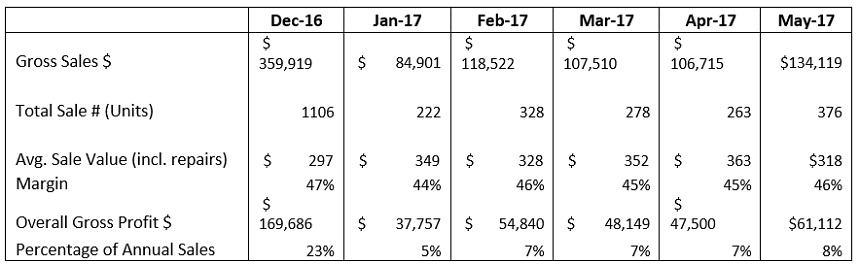
So how do your sales compare? If you receive our monthly KPI report data you will receive information that will show your numbers alongside these figures, but if not you can still make a comparison.
Grab a recent “Sales Report by Category” for the month of May from your system and arm yourself with a highlighter. Find the following sales data from your own report:
- Gross sales
- Total units sold
- Average retail sale value
- Margin
- Gross profit
How do your numbers compare to the data above? You should see areas where you are above and possibly other areas where you are below the data recorded.
Advertisement
This data only represents one month, which can be misleading. Print a Sales Report by Category for the last six months and compare your average sale and margin over this time period. How does your average sale and margin compare with the figures indicated above across the six months?
Notice we aren’t focusing on sales here. Sales are a by product of other variables; you can’t increase sales without increasing either the average retail value of what you sell or the number of units you are selling. Likewise we aren’t focused on gross profit – this can’t be lifted without either increasing the two variables mentioned above or increasing the margin being achieved on your existing sales.
You will be doing better than the average in some areas of your business. Congratulations! You will also likely find that you are lower in other areas. You should be getting a clearer idea of which parts need your attention in order to improve.
Let’s dive a little deeper into the numbers.
Assuming your average sale is higher or your margins are lower you may be selling more diamond than the typical store. If you’re finding you have a lower average sale but higher margins you may be selling less diamond product than the averages indicated. So how do you know if this is the case? Easy – we have that breakdown also: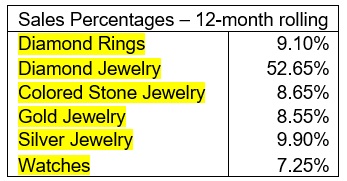
The above chart shows the typical breakdown of stores for the last 12 months in terms of percentage contribution from each of their main areas (the figure for diamond jewelry also includes the diamond rings percentage listed above it). You can now see your sales mix relative to the typical U.S. store.
Advertisement
Grab your Sales Report by Category for the last six months (or 12 if you have one) and compare your own figures. How do you match up on diamonds? If you are achieving a lower percentage of diamond sales but your margins overall are lower then that’s a red flag.
You should not be achieving lower margins if diamonds are a less significant part of your business than the average data. Likewise if your contribution from diamonds is higher than this percentage but your average sales figures are lower than that might indicate that the average sales you are achieving in diamonds are considerably lower than that being achieved by the average store.
Data can be a good indicator of performance and can create the questions you need to ask in order to improve results. “Why is my store’s average sale lower than the data average when diamonds represent a more significant part of my business?” is a great starting question.
DAVID BROWN is president of the Edge Retail Academy, an organization devoted to the ongoing measurement and growth of jewelry store performance and profitability. For further information about the Academy’s management mentoring and industry benchmarking reports, contact inquiries@edgeretailacademy.com or phone toll free (877) 569-8657.