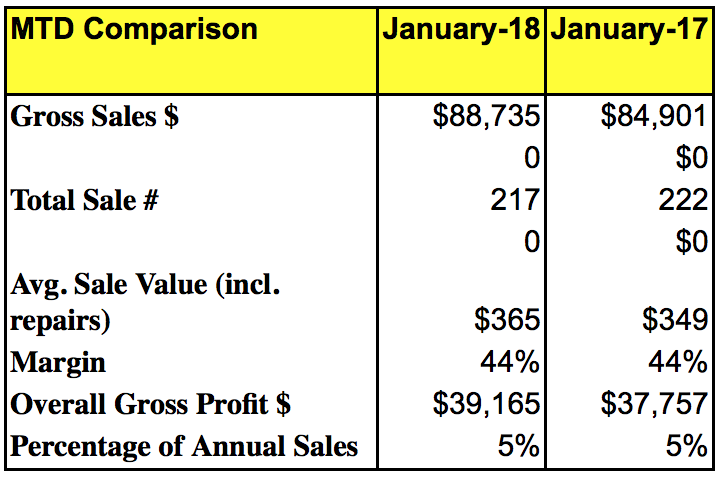
January got off to a positive start for most stores in our data pool, with same-store sales for the month averaging $88,735, up from last January’s $84,901, an increase of 4.5 percent. Average sales increased to $365 from $349, an increase of 4.6 percent. Quantity of sales showed a slight drop from 222 to 217 units. Gross profit increased from $37,757 to $39,165 on a continuing margin of 44 percent.

The increase has lifted rolling 12-month sales from $1,625,921 to $1,629,755 on an average sale up just $1 to $388. Sales units are down just five items to 4,196 for the 12 months. Gross profit is up from $741,609 to $743,017.
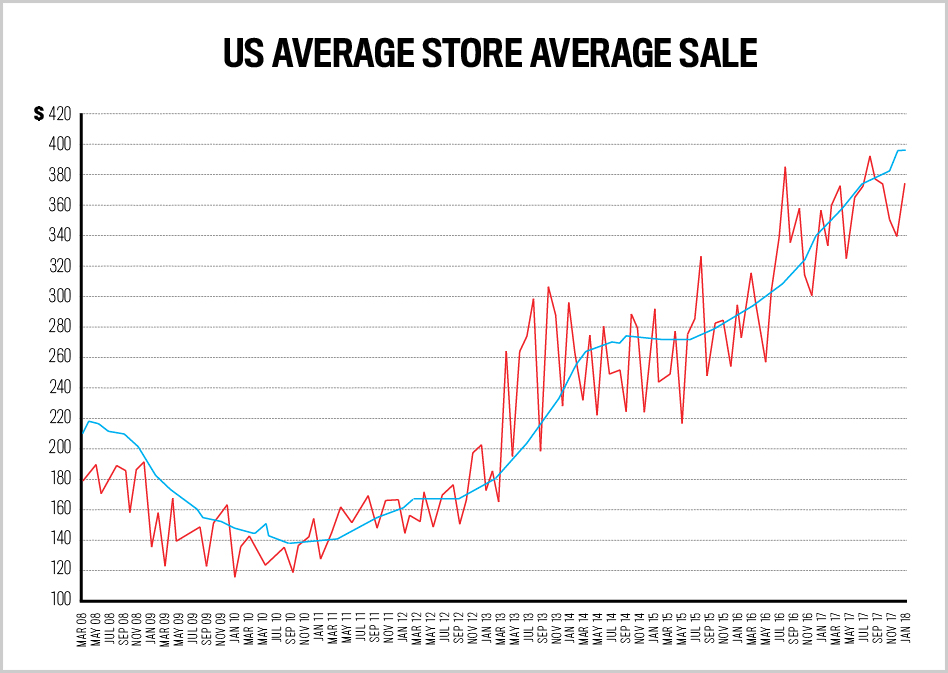
January represents one of the lowest fluctuations in the average sale/units sold dynamics with the recent trend of dropping units/increasing average sale slowing considerably. Is this the beginning of stabilization in average sale/units sold increases or decreases? The graph below sheds some light.

The chart shows the average sale over the last 10 years of data collected. The blue Series 1 line represents the rolling 12-month figure in average retail achieved with the red Series 2 line showing the monthly fluctuation. As the data shows, over the long term there has been a relatively steady increase in average retail achieved up until 2013 with a leveling off in average sale achieved between 2013 and 2015. Since 2015 there has again been an upward swing in the rolling 12-month average retail achieved, but what is noticeable is the leveling off in the monthly average retail price achieved since around the middle of last year. As this data begins to impact the 12-month rolling average retail, we will begin to see a flattening out of this figure showing that growth in average retail may be coming to a close.
Advertisement
There are only two components of sales: the average retail price and the quantity that you sell. If one is not growing, then growth has to come from the other. A leveling-off in average retail selling prices will mean a need for a compensating increase in units sold – a tough ask in a market where there has been a rapid rate of decline in unit sales.
The graph below shows the trend in unit sales over the last few years. Unfortunately, we don’t have the monthly unit fluctuation as an indication of long-term trend, but the data does demonstrate that there has been no reversal in unit sales that would help to compensate.
So what action does an individual store need to take to overcome these numbers? Either a continuation of the trend in increasing average sale needs to happen or a reversal of the trend in declining units sold (or ideally a happy combination of both).
Changing a trend in unit sales will require an analysis of how unit sales are being made up relative to your traffic. Every sale is part of a funnel – for an item to be sold a customer has to exist, for a customer to exist a prospect must enter your store, for someone to enter your store something must prompt traffic to be aware of you. Let’s look at a typical scenario:
- Customers pass your store/see your ad/search for product – 10,000.
- Customers enter your store/click on your website – 100.
- Customers purchase – 10.
- Customers buy more than one item – 1
If you want to improve the trend of units sold you must make a difference in the ratio of one of these areas. Do more to attract interest in your store, persuade more customers to enter your store or website, have them purchase, or encourage them to make a second, third or fourth purchase. Where you focus your marketing on this will depend on your strengths and where you feel you can get the best return on your investment.